Creating Cohorts of Songs
A Machine Learning clustering analysis of The Rolling Stones' Spotify library to uncover musical patterns and improve recommendations.
Problem Statement
In modern digital platforms like Spotify or Netflix, customers look forward to specialized treatment and a highly tailored content experience. Providing user recommendations that strongly align with their references and habits is key to maintaining customer engagement.
Spotify, boasting millions of active users, aims to curate cohorts of different songs to enhance song recommendations. By grouping songs with similar audio properties to ensure relevance, the streaming platform can personalize suggestions even more effectively.
Objective
To analyze a dataset from Spotify's API featuring albums by The Rolling Stones. The goal is to perform Exploratory Data Analysis (EDA) and apply Unsupervised Machine Learning (Cluster Analysis) to understand the factors driving popularity and group these songs into meaningful musical cohorts computationally.
Key Findings & Results
The analysis leveraged various audio features such as acousticness, danceability, energy, liveness, valence, loudness, and tempo to map out the nature of these tracks. Below is a summary of the exploratory data analysis and the resultant dimensionality reduction driving our clustering algorithm.
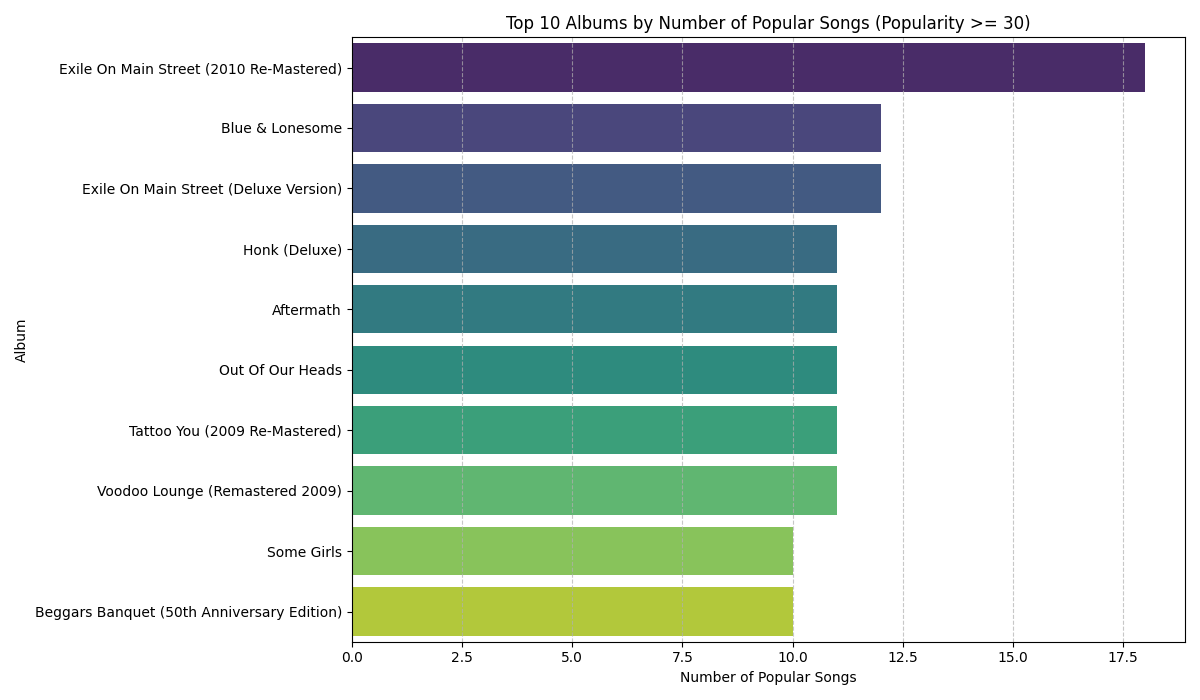
Most Popular Albums
Before diving into continuous feature correlation, it's essential to understand the distribution of popular hits across the band's discography. This highlights the top 10 historical albums holding tracks that achieved the highest popularity ratings on Spotify.
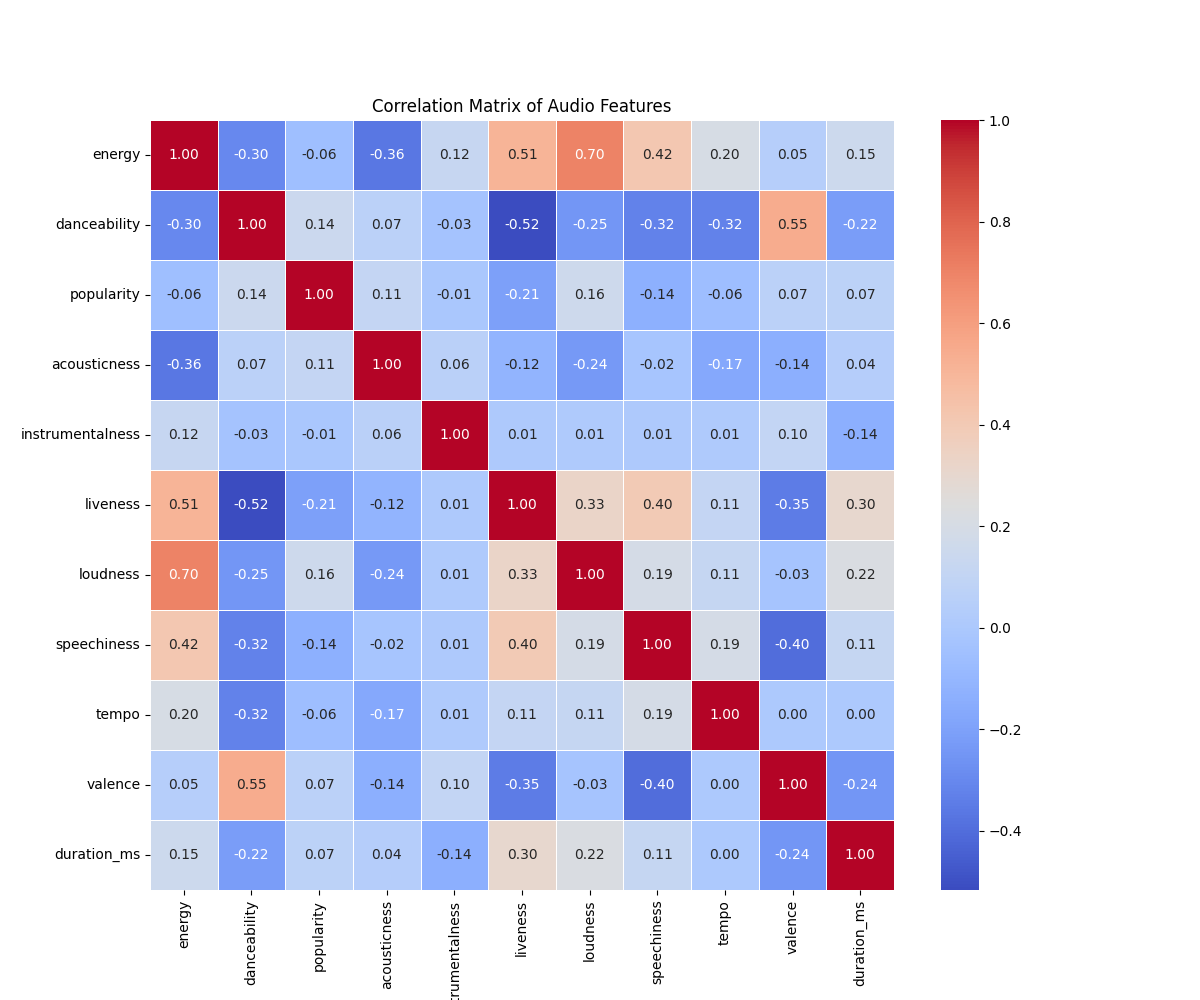
Correlation Among Audio Features
Through bivariate analysis, we examined the relationship between track popularity and individual metrics like tempo, acousticness, or valence. Interestingly, popularity is quite dispersed: both energetic upbeat hits and slower emotional ballades can achieve massive popularity.
The correlation matrix confirms that popularity doesn't map directly to a single factor. However, logical structural linkages exist (e.g., highly energetic tracks are visibly negatively correlated with acousticness).
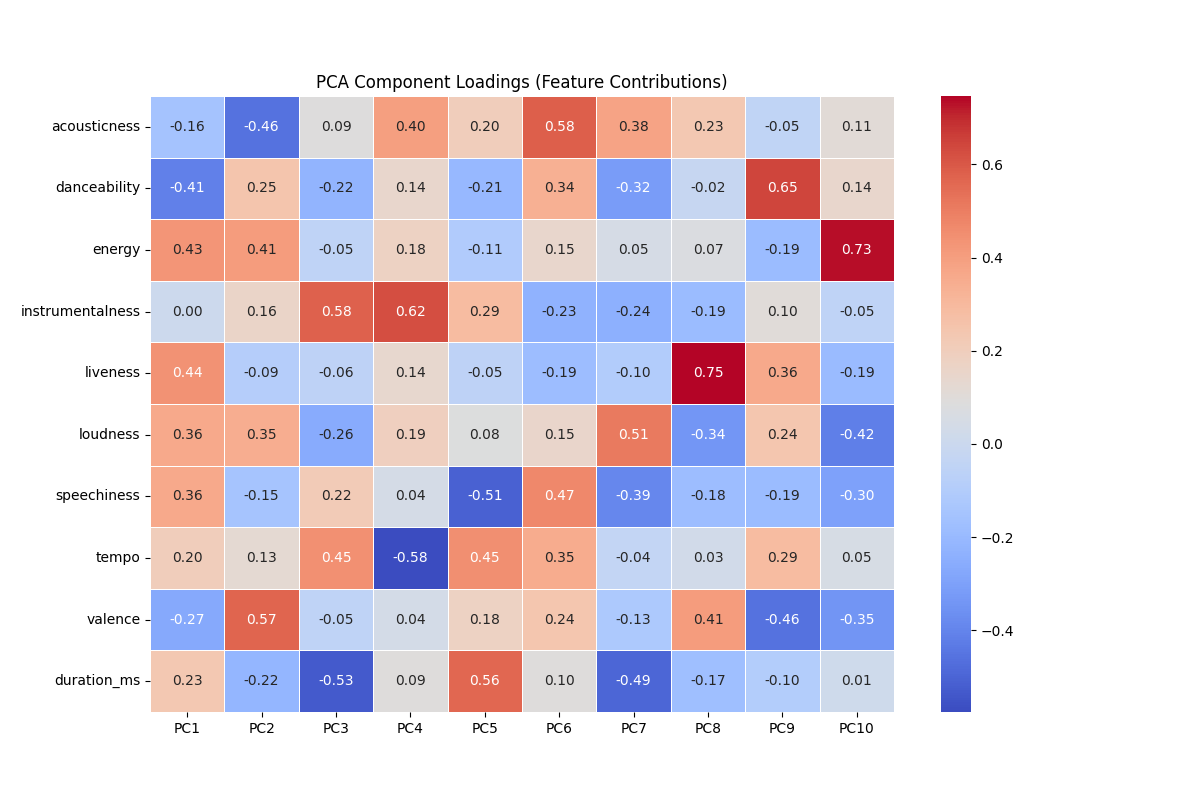
Feature Engineering: PCA Components
Given the multi-dimensional complexity without single 'silver-bullet' indicators, we apply Principal Component Analysis (PCA) to bundle our variables into orthogonal components.
- Principal Component 1 (Energy/Intensity Axis): Captures energy, loudness, and danceability. It distinguishes high-energy intense tracks from calm, soft ones.
- Principal Component 2 (Mood/Style Axis): Highlights valence, acousticness, and instrumentalness. It separates happy/emotional acoustic songs from neutral electronic ones.

Cohorts Validation: K-Means Clustering
Leveraging K-Means clustering (using K=3 defined via Elbow method) on the PCA-reduced data successfully segmented the songs into three distinct, easily distinguishable cohorts.
Conclusion
Our clustering isolated songs into meaningful groups representing romantic/slower moods versus powerful/high-BPM energy tracks independently of pure popularity metrics. This structure proves algorithms can automatically detect song vibes across large datasets, forming specialized sets to recommend whenever a user wants a chill acoustic session or a high-energy dance track.